


This Assignment Part 1 is worth 20% of your final mark for STA10003.
Scenario: You are a new graduate researcher at a health sciences research institute. You have been given a
dataset which contains the treatment records of 1000 Australians who were admitted to a hospital for suspected myocardial infarction [heart attack], and asked to analyse the data to answer several questions of interest that are presented on the following pages.For your assignment you should use the data set STA10003 Sem 1 2021 Assignment Data.sav provided in Week 06: Assignment Part 1 Instructions & Data File which can be accessed within the Week 06: Assignment Part 1 page.
STA10003 Foundations Of Statistics Assignment-Swinburne University Australia.

Data Preparation:
For the purpose of your report, you must use SPSS to draw a random sample of 400 cases of the 1000 observations. You will conduct your analysis on this sample of 400. Instructions on how to generate your random sample are on pages 5 to 8 of this document. Note, however, that some variables contain missing values, so each of your analyses might not contain the entire 400 cases.
For your Assignment – Part 1, you are required to complete the first three (3) questions by producing the appropriate analyses using SPSS and writing the relevant report for each question. You are also required to complete questions 4 and 5, which contain short answer questions.
For each of the first three questions requiring SPSS, you should include the relevant output immediately following your report. Graphs which are part of the report should be included within the report as shown in the report writing examples. See Supplement B: Reporting Information about Single Variables and Supplement C: Choosing the Correct Analysis.
Question 1: Prescribed clot-dissolving drugs
The variable ‘clotsolv’ indicates the type of clot dissolving drug prescribed to patients admitted to hospital for suspected myocardial infarction. Using SPSS, produce the relevant graph and table to summarise the ‘clotsolv’ variable and write a paragraph explaining the key features of the data observed in the output in the style presented in the course materials.
STA10003 Foundations Of Statistics Assignment-Swinburne University Australia.
Question 2: Patient age
The variable ‘age’ indicates the age of patients in years. Using SPSS, produce the relevant graph and tables to summarise the ‘age’ variable and write a paragraph explaining the key features of the data observed in the output in the style presented in the course materials.
Question 3: Length of stay in the hospital
The variable ‘los’ indicates the number of days that patients spent in the hospital. Using SPSS, produce the relevant graph and tables to summarise the ‘los’ variable and write a paragraph explaining the key features of the data observed in the output in in the style presented in the course materials.
Question 4: [does not require SPSS]
Nick is a psychology student who participates in sprint triathlon competitions which consist of swimming, cycling, and running in one event. In the last competition, Nick completed the swimming race in 13 minutes and 20 seconds (800 seconds), cycling in 33 minutes and 52 seconds (2032 seconds), and the running race in 17 minutes and 3 seconds (1023 seconds).
Completion times for participants in Swimming are normally distributed with a mean of μ = 695 seconds and a standard deviation s = 50 seconds. Completion times for participants in Cycling are normally distributed with a mean of μ = 2184 seconds and a standard deviation s = 76 seconds. And completion times for participants in Running are normally distributed with a mean of μ =1083 seconds and a standard deviation s = 50 seconds.
In which competition race (swimming, cycling, or running) was Nick’s performance better,relative to others on average who took part in that competition? Justify your answer, quoting relevant statistics as part of your explanation.
Question 5:
Vitality Creams produce a moisturising cream, which has been selling extremely well – particularly the 375ml container [s = 20ml]. Some stockists, however, have recently complained that these containers appear to contain less than 375ml of moisturising cream.
STA10003 Foundations Of Statistics Assignment-Swinburne University Australia.
The production line manager thinks that the machinery filling the containers might not be working properly, so he takes a random sample of 500 moisturising cream containers produced during January to check the contents.
a.What is the population we can draw conclusions about in this study?
We have produced a sampling distribution using 200 samples of size 500, taken from a population where the mean is 375ml [s = 20ml]. The sampling distribution is displayed below in Figure 1.
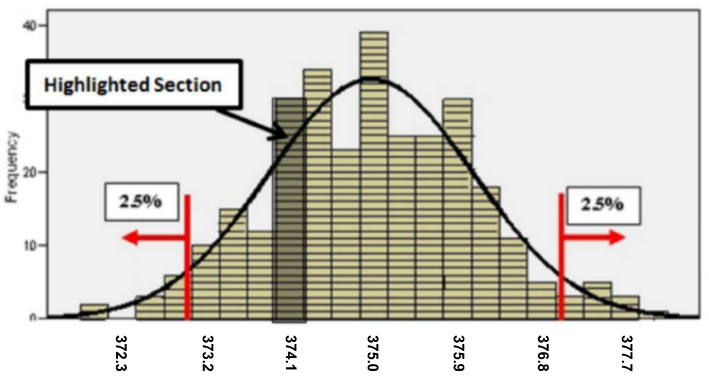
Figure 1: Distribution of sample means in 200 samples of size 500, taken from a population where the mean is 375 ml and the standard deviation is 20ml.
To answer questions (b) to (d), consider the sampling distribution shown in Figure 1.
b.What does the highlighted section of the sampling distribution in Figure 1 represent?
c.The random sample of 500 containers of moisturising cream taken by the production line manager turn out to have a mean of 377.4ml.
Does this sample look like it belongs to the sampling distribution displayed in Figure 1? Justify your answer.
d.Given that the sample was randomly selected from all containers of moisturising cream produced by Vitality Creams during January, and given that the amount of moisturising cream in each container was measured accurately, what conclusion can we reach from part (c)?
How to generate your random sample of 400 observations.
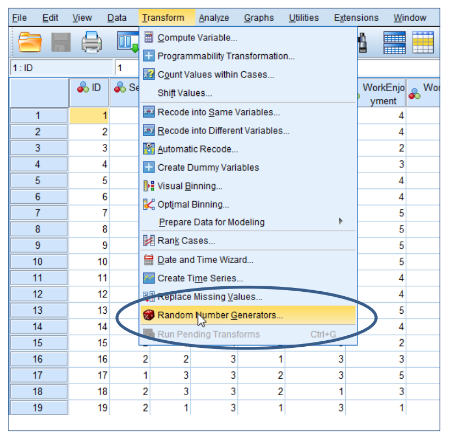
1.Open the STA10003 Sem 1 2021 Assignment Data.sav data file. From the Transform drop-down menu, select Random Number Generators from the menu
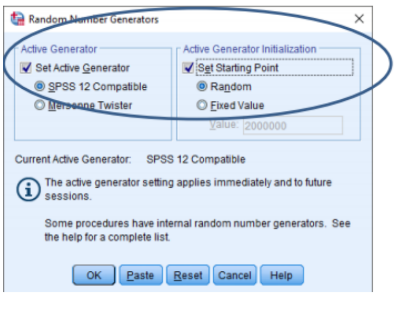
2.From the Random Number Generators dialogue box, click the boxes beside Set Active Generator and Set Starting Point as shown below. Then click OK.
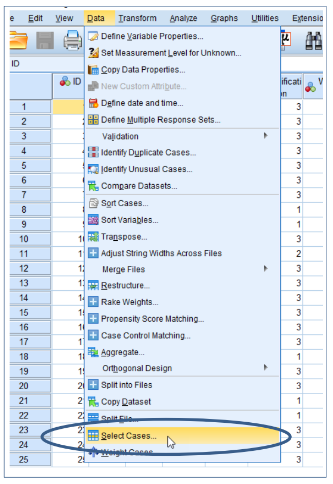
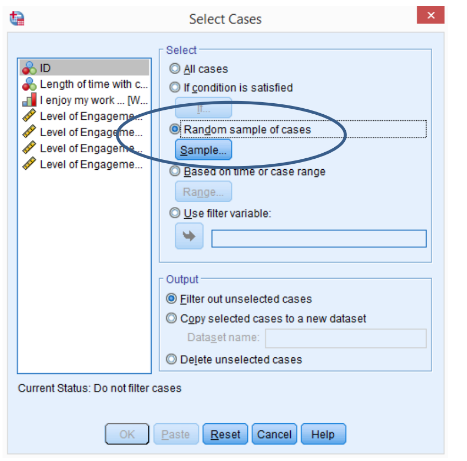
3.From the Data drop-down menu, choose Select Cases
4.From the Select Cases dialogue box, choose Random Sample of Cases and then click the Sample button.
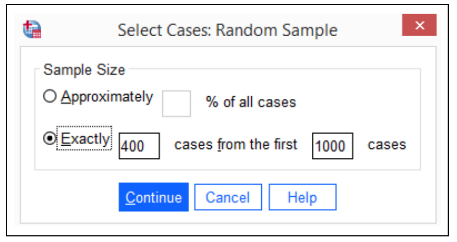
5.From the Select Cases: Random sample dialogue box, click Exactly and type 400 cases from the first 1000.
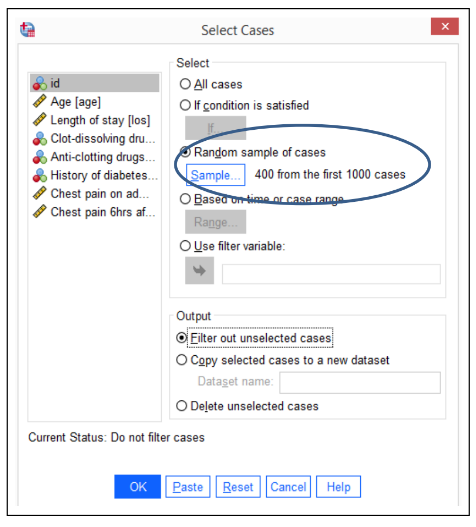
6.After entering the information above, click Continue [this returns you to the Select Cases Dialogue Box where you will see, next to the Sample button, confirmation of the 400 cases selected].
7.We can remove the un selected cases by clicking the Delete un selected cases button under the Output heading.
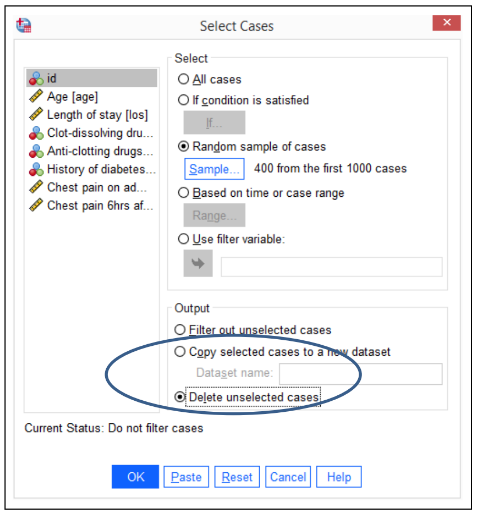
8.After clicking OK, your data set will now only show the 400 cases selected.
9.You should now save the data file with a new name.
STA10003 Foundations Of Statistics Assignment-Swinburne University Australia.
ORDER Now This STA10003 Foundations Of Statistics Assignment And Get Instant Discount