


Task For Financial Management: Capital Asset Pricing Model Issues And Capital Budgeting
Introduction
The Financial Management of different investments are the most important part of the strategic decision-making (Kahraman et al. 2002). If the investors are sore about the types of risks related to the investment then the number of investment decisions will increase. According to Duffie (2001), the various pricing models and the financial ratios and also the different capital budgeting techniques combined together will help the investor to analyse the ways in which he can utilise the money. The investment decision is a tough decision as the investor will be expecting the high return on the money he is spending hence it is very essential on the part of the Financial Management to make use of the different tools to analyse the present market conditions (Wilkes, 2007).
Part a
Analysis of Capital Asset pricing method (CAPM)
Explanation of CAPM
The capital asset pricing model which was introduced in the year 1970 by William Sharpe and Jack Treynor is the model which is extensively used for the analysis of the capital asset pricing theories (Jafarizadeh and Ramazani Khorshid-Doust, 2008). The major application of this model is the estimation of the costs of capital for a business and evaluation of the performance of the firms by the Financial Management of the portfolios. Her main idea behind the implementation of this model is the measurement of the systematic risk of the portfolio. According to Xue-zhi (2004), the systematic risk is the type of market risk which cannot be diversified hence the investors are highly concerned about this risk while investing in a particular portfolio. Hence this tool was invented to measure the systematic risk while calculating the expected rate of return of an investment.
The formula for the CAPM is as follows:
Ra = Rf + β (Rm – Rf)
Where :
Rf = Risk-free rate
β = Beta of the security
Rm= Expected market return
(Rm – Rf) = Equity market premium
According to Klammer (2011) the theory depicts that an investor will earn more only when the stock in which he is investing is less risky than the other stocks.
Issues related to CAPM
The major problem faced by the analysts to use the CAPM model is the inclusion of the Beta in the calculation of the risk (Aggarwal,2000). The differences of the beta value over a long period of time in a particular stack fails to explain the performance of the stocks over that time period. Hence the findings of the CAPM model may be misleading. However, Bierman and Bierman (2008) are of the opinion that although it is difficult to identify the movement of stocks with the help of the beta still the investor can ensure that a portfolio with high beta will move more than the market and a portfolio with a low beta will move less than the market.
Advantages and disadvantages of the theory of CAPM
According to Gitman and Forrester (2007) the CAPM has several advantages over the other models used for the valuation of the portfolio. They are as follows:
- The model considers and pays more emphasis on the calculation of the systematic risk whereas the other models are mainly focused on the diversification of the unsystematic risk. In the real scenario, the investors are more concerned about the reduction of the systematic risk (wfu.edu, 2014).
- It establishes a relation between the required return from the investment and the systematic risk which helps in researching of the investor.
- It is considered as a better method for calculation of the return on equity instead of the Dividend growth model (Block, 2004).
- It is also the useful tool for providing discount rates and is considered as a good tool over the weighted average cost of capital for the purpose of investment appraisal (Klammer, 2012).
The model also suffers from certain disadvantages which make the other tools important for the analysis purpose (Gregoriou and Ioannidis, 2007).
- According to Nugus (2009) a number of assumptions under the CAPM theory don’t match with the real market conditions. The assumption stating that the real life capital markets are perfect and the assets are priced correctly is a wrong assumption.
- The theory include the borrowing of the investors at a risk free rate but it is not possible for all investors to borrow at risk free rates hence they experience a shallower slope of the security market line (Brav et al. 2012).
- The CAPM can also not be used effectively for the calculation of the investment appraisal because the model takes into account the single period’s consideration whereas the investment appraisal needs to be done a long term basis.
Assumptions of the model
According to Wilkes (2007) the CAPM theory is based and operates on the basis of te following assumptions thus made against the theory
It is assumed that the asst quantities are fixed and mentioned in the market and the investors aim to maximise them.
It is assumed that all the participating investors in the market are rational and risk averse and have the same kind of expectations (Gregoriou and Ioannidis, 2007).
The information regarding the share markets is always assumed to be available to the investors and the investors have to accept he price which is mentioned to them.
It is also assumed that the investors can borrow at risk free rates of interest and the there is no transaction cost involved with same (Bierman and Bierman, 2008).
Relation of CAPM with security market line (SML) and capital market line (CML)
The SML is the graphical representation of the results of the CAPM model. It is essentially a line that shows the systematic risk versus return of the whole market at a time period and it also shows the securities which are risky (Duffie, 2001). It is a useful tool for determining whether an asset offers a reasonable rate of return and risk associated with it.

Figure 1: Security market line
(Source: Wilkes, 2007, pp-56)
According to Duffie (2001) if the comparison between the risk and the return is plotted above the SML then the investor can expect a greater return for the risk and vice versa. The CML, on the other hand, is the set of lines which illustrates the rates of returns for the efficient portfolios ad this efficiency of the portfolios are calculated based on the risk free rate of return and the level of risk associated with the portfolio.
According to Bierman and Bierman (2008) both SML and CML are the lines that connect the risk-free asset with the market portfolio. The technical difference between the two are that SML is the Calculation of the systematic risk only whereas CML is the calculation of the total risk (Systematic+ unsystematic risk).However, since the systematic risk cannot be diversified hence all the portfolios need to lie on the SML and only the efficient portfolios will lie on the
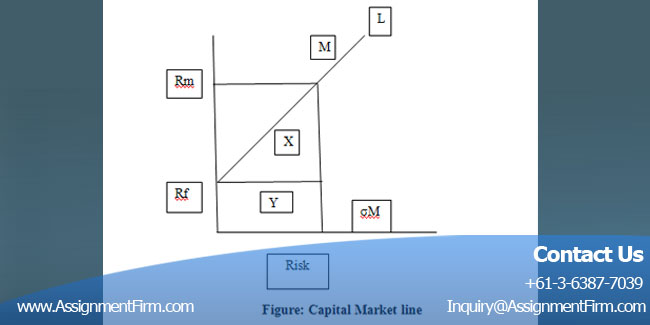
Figure: Capital Market line
(source: Duffie, 2001, pp-34)
The line from Rf to L is the CML where
X = Risk premium
= Rm – Rf
Y= risk = σM
Slope = X/Y
= (Rm-Rf) / σM (The slope here is the market price of risk for the efficient portfolios)
Y- Intercept = Rf
Alternative models which can be used in place of CAPM
According to Gregoriou and Ioannidis (2007) since the CAPM model has some flaws in its assumptions and also some flaws in the beta calculation hence the use of other models are implemented to effectively calculate the decision making process. Some of the alternative models used for this purpose are the Arbitrage Pricing Model which shows multiple sources of market risks. The multi-factor model is also used which uses the historical data to analyse the return. According to Duffie (2001) various accounting models can also be used for this purpose. The accounting analysis involves the measurement of the risk and the rate of return on the basis of some predesigned ratios and this gives the investor a clear view of the rate of return he can expect from a particular investment. (Wilkes, 2007) are of the opinion that the mean Variance framework can also be used which shows the difference between the expected and the actual returns.
Conclusion and recommendation about CAPM theory
From the above discussion about the model, it can be duly stated that the model is very simple to be used and can be easily interpreted by the investors. It provides an easy way of understanding the required returns and the costs of equity for the individual companies with the help of only one input and that is market beta of the share. Although the model has a few problems it may be noted that the model here tries to identify the market conditions based on the assessment of the systematic risk.
The mangers in this respect can take the various investment decisions based on the nature of the investment. In the case of long term investment it is advisable for the mangers to assess the level of risk involved with the project and also to identify the probable rate of return that the project can produce. If the business is high performing then the manager can afford to make investments in the new areas of marketing to generate more income. Another factor that should be present within the business should be the confidence of the mangers in the business position. This helps the business to invest in the capital assets.
Part b
Capital budgeting technique
According to Gregorio and Ioannidis, 2007) the capital budgeting technique is used to determine the long-term investments of a company. The long-term investments generally constitute of the investments in the replacement of plant and machinery, new plant introduction and also the development of certain research projects. One of the primary objectives of the capital budgeting technique is to increase the shareholder’s wealth. Some of the major techniques used in the capital budgeting technique are the Accounting rate of return, payback period, net present value (NPV), and internal rate of return, Profitability index (Block, 2004).
Conclusion
The different investment techniques are the important techniques which should be used by the investors to value the market position of the shares and also to rate the investments depending upon their rates of returns. The investors find the analysis useful and can make the decisions accordingly as to which investment they should choose. If the risk associates with the investment is fruitfully analysed then the investor will have an opportunity of diversifying the risks or may be able to change to a better alternative.