Q1: (a) Difference between the Keynesian and monetarist views on how an increase in the money supply causes inflation;
(b) Why is the show of the aggregate supply curve important to the Keynesian monetarist controversy in Macroeconomics Help?
Answer:
| Keynesian Model | Monetarist Model |
| In the Keynesian theory, the economy is mainly divided into two basic features first one is the “real economy” which evaluates factors of material production like labour, and the “monetary economy,” which determines factors of valuation with the price level. Keynesians generally believe that real economy mainly based on issuers like reduced labour demand or fiscal policies of Government (Anderton, 2009). It reflects a greater effect on economic growth of the population, inflation recession.
|
Monetarist theory manly include effects of policies regarding the size and structure of the money supply, questions regarding price levels, the market value of currency and exchange rate and the availability of credit. Apart from that this theory focuses on the economic events that can make tinkle in the amount of money available for use by the economy (Thurow, 2005). It has a more substantial impact on short-term productivity than do factors such as employment levels, inflation rate control aggregate demand or government fiscal policy like the Keynesian model. |
In times of Macroeconomics Help recession, when productivity declines and unemployment levels rise, the economists mainly raise the contrast between Monetarist and Keynesian theories of money. Keynesian economists mainly engaged themselves in seeking the solution to get rid off from the recession by addressing weak economic conditions identifying different fiscal government stimulus efforts to increase government expenditure, lowering down the taxation rate and giving the suggestion to invest in long-term productive output in an expectation of increasing economic demand by these policies. On the contrary, Monetarists giving more emphasis on increasing the supply of money available to lenders and businesses firms, which will create a easier access to credit and be more effective in generating productive growth of the whole economy as they conclude. Sometimes the money regulatory authority like Governments and central banks deploy different economic policies to control recession’s situation and increase the economy in an effective way.
(b) According to Keynesians, Aggregate Supply curve is more horizontal than vertical in the short run so stabilization policy can impact hugely on output and employment but the controversy begins as Monetarists believe that the economy is inherently stable, they tend to view the Aggregate Supply curve as more vertical so discretionary stabilization policy is not as important (Gillespie, 2011).
Q 3: Using the aggregate demand-aggregate supply (AS-AD) diagram, show how the four unrelated economic events would affect economic activity and the price level.
Answer:
(a) A significant destruction in economy’s capital stock because of an earthquake:

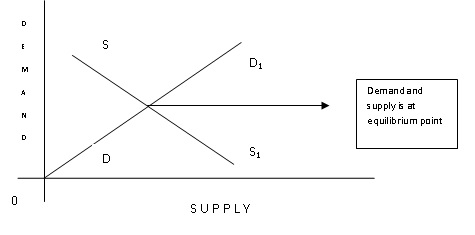
Graph 1: aggregate demand-aggregate supply (AS-AD) diagram
(Source: Smith D.2012, page-256)
There should be the scarcity of the goods as productivity stops completely due to the significant distraction of the infrastructure of the country. Supply should be less and the demands of the necessary and griffin goods should be higher in the level. The total capital stock of the country will decrease in significant level along with total GDP.
(b) An increase in personal income Tax:
Incensement in personal income tax will demotivate the buyer to buy in a general manner. Everybody will try to restrict his or her expenditure into a certain limit. In addition, as result of that supply of the goods will be there in the market but the demand for the good will decrease in a significant level (Jenkins,2009).

Graph 2: aggregate demand-aggregate supply (AS-AD) diagram
ORDER This Macroeconomics Help NOW And Get Instant Discount
(C) An increase in exports:
If a country increases their export service then it is obvious that due to cause export the supply of goods and services will decrease in national level but as the other condition of the economy will remain unchanged the demand, on the other hand, will increase gradually. In addition to it certainly, the cost of the available product will increase in significant level, because of that inflation can be raised.

Graph 3: aggregate demand-aggregate supply (AS-AD) diagram
(Source Smith, 2012, page-256)
(d) An improvement in the marketing and selling of firm managers:
If the marketing and selling skills of firm managers of a country increase then due to cause of effective marketing strategy and proper implementation of the sales force the supply of the products band the goods will increase. On the other hand, the promotional strategy of the firms attracts people to purchase more and consume in a larger amount. Therefore, the supply and demand of the goods will increase hand by hand and a point of equilibrium will establish (Lansley, 1994).

Graph 4: aggregate demand-aggregate supply (AS-AD) diagram
(Source Smith, 2012, page-256)
Q.6. (a) Describe what mpc with formula;
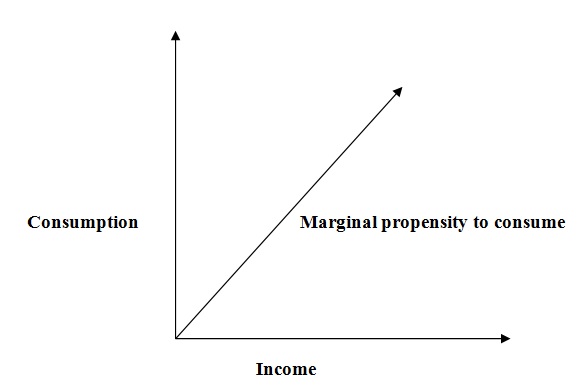
In economics, marginal propensity to consume (mpc) means that the proportion of total income or of an increase in income that consumers tend to spend on goods and services instead of saving it. It is a component of Keynesian macroeconomic theory and is calculated as the 1 unit change in consumption divided by the 1 unit change in income. MPC can be depicted by a consumption line- a sloped line created by plotting change in income on the horizontal x-axis and change in consumption on the vertical y-axis.
Formula:
(MPC) is equal to ΔC / ΔY, where ΔC is changed in consumption, and ΔY is changed in income. If consumption increases by 75 units for each additional unit of income, then MPC is equal to 0.75 / 1 = 0.7

Graph 5: Marginal propensity to consume Graph
(Source: Begg et al., 2009, page-145),
(b). Assume that GDP rises from $550bn from $650bn and that this results in consumption of goods and services rising from $340bn to $400bn. What is mpc?
Salutation:
As per the question, As GDP rises from $550 to $650,
The total amount increased in income is $ (650-550) $= $ 100 (ΔY)
As consumption of goods and services rising from $340 to $400,
The total amount of increasement in consumption is $ (400-340) = $70 (ΔC)
Hence, t
mpc will be (ΔC)/ (ΔY) = 70/100 =0.7
(c)
As mpc, remain fixed as 0.7
So, here the total no of increased income (ΔY) =$(700-550)= 150
The level of consumption will be (ΔC)/150=0.7
Therefore,
(ΔC)= 105 and C will be $(340+105) = $445
(d) The GDP will increase in this case
As the consumption of goods and services 400$, investment is 120$, government expenditure $150, and exports of goods and services are $140 then the level of total aggregate expenditure (E) will he (400+120+150) = 670$
(e) If an expenditure is currently $650 then it will be an increase in GDP because to expend more the people will earn more rote balance their propensity of consumption.
Q 8: Australia’s Balance of Payment account
| Categories | Elements of Australia’s Balance of Payment Account
|
| (a) DVD recorders imported into Australia from Japan | (i) Imports of goods |
| (b)Insurance cover purchased in Australia by overseas residents | (ii) Capital transfers overseas from Australia |
| (c) The nation gives overseas aid to a developing country | (v) Other income outflows |
| (d) US car company sets up factory in Australia | (x) Investment in Australia from overseas |
| (e) Some of the nation’s residents take a holiday in Bali | (Xiv) Drawing on reserves |
| (f)v Interest earned by Australian residents on overseas assets | (viii) Capita transfers to Australia from overseas |
| (g) Running down the stock of foreign exchange in the Reserve (central) Bank of the nation | (xiii) Migrants to the nation transferring property to the nation |
| (h) Migrants to the nation transferring property to the nation | (vi) Other income inflows |
| (i) New deposits made in banks in the nation by overseas residents | (Xii) Short-term financial inflows |
| (j) the nation’s palm oil is sold in the United Kingdom | (ii) Exports of goods |
Q 9. The difference between cost-push and demand-pull inflation with a diagram:
| Cost push Inflation | Demand pull Inflation |
|
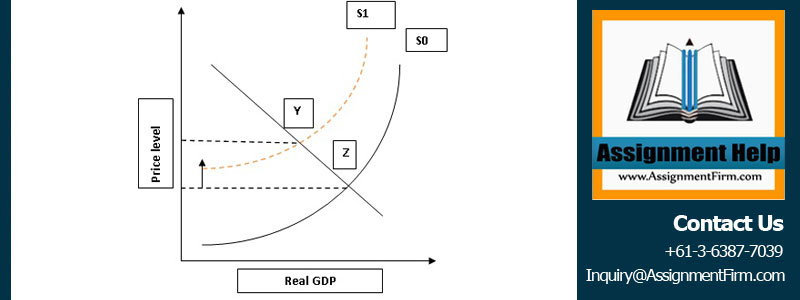
Aggregate supply of an economy consist of the total volume of goods and services produced by an economy at a given price level. Cost-push inflation happens when there is a decrease in the aggregate supply of goods and services resulting from an increase in the cost of production. Cost-push inflation mainly occurred when the prices have been “pushed up” by increases the costing of any of the four factors of production (labour, capital, land or entrepreneurship). It is not possible for the companies to maintain profit margins by producing the same amounts of goods and services when it already running at full production capacity with higher production costs and productivity maximized. In order to maintain the balance, the increased costs are passed on to consumers, causing a rise up in the general price level (inflation) (Wall , 2003). |
Demand-pull inflation occurs when there is an incensement in aggregate demand. The demand can be categorized into four sections of the macroeconomy like households, businesses, households, governments and foreign buyers. Due to the over purchasing capacity of those four factors than the economy can produce they engaged into a competition of purchase limited amounts of goods and services. Total demand of the economy surpasses the total supply. Generally, the purchasers obviously “bid prices up”, again that cause inflation. This excessive demand of the economy can be, described as “too much money is chasing too few goods”, and usually occurs in an expanding economy in the developed country. |
ORDER This Macroeconomics Help NOW And Get Instant Discount
Cost-push Inflation:

Graph 6: Cost-push Inflation
(Source: Smith 2013,page-182)
Demand-Pull Inflation:
(b) Provide causes of two types of inflation:
Causes of Demand pull inflation:
The first cause of demand-pull inflation can be growing economy of any country. When habitats of demographic land feel confident that they will get better jobs and earn enough for living in future, that their homes and other monitory investments will increase in value, and governing authority is doing the right thing in guiding the economy by implementing newer and effective economic policies, they will spend more instead of saving. They will also increase their spending in credits by investing more in borrowing auto or home loans, or credit cards. It creates gradual and steady price increases for the economy and leads to inflation(Begg et al.2009),.
Expectation of inflation is a second reason for demand-pull inflation. Federal Reserve Chairman Ben Bernanke pointed this out. According to him, once people expect inflation in near future then they will buy things in the present before prices go up further in the future. This increases demand, which then created demand-pull inflation.
Causes of Cost push Inflation:
Big corporate in longthe run if they can achieve a monopoly over an industry they can easily tinkle the price of the particular product or services according to their profitability and can create cost-push inflation. This can also be a cause of reducing in supply, because the company controls the supply of that product or service.
Wage inflation is another cause of cost-push inflation. This is when workers have the power for demanding wage increases and to fulfil that companies then pass through the burden of that overhead cost to consumers by marketing the product or service in higher prices. At the end all, this leads to a cost push Inflation.


