


Purpose:
This assignment aims at Understand various qualitative and quantitative research methodologies and techniques, and other general purposes are:
HI6007 Statistics For Business Decisions Assignment-Holmes Institute Australia.

1.Explain how statistical techniques can solve business problems
2.Identify and evaluate valid statistical techniques in a given scenario to solve business problems
3.Explain and justify the results of a statistical analysis in the context of critical reasoning for a business problem solving
4.Apply statistical knowledge to summarize data graphically and statistically, either manually or via a computer package
5.Justify and interpret statistical/analytical scenarios that best fits business solution.
Assignment Structure should be as the following:
This is an applied assignment. Students have to show that they understand the principles and techniques taught in this course. Therefore students are expected to show all the workings, and all problems must be completed in the format taught in class, the lecture notes or prescribed text book. Any problems not done in the prescribed format will not be marked, regardless of the ultimate correctness of the answer.
(Note: The questions and the necessary data are provided under “Assignment and Due date” in the Blackboard.)
Instructions:
- Your assignment must be submitted in WORD format only!
- When answering questions, wherever required, you should copy/cut and paste the Excel output (e.g., plots, regression output etc.) to show your working/output.
- Submit your assignment through Safe-Assign in the course website, under the Assignments and due dates, Assignment Final Submission before the due date.
- You are required to keep an electronic copy of your submitted assignment to re-submit, in case the original submission is failed and/or you are asked to resubmit.
- Please check your Holmes email prior to reporting your assignment mark regularly for possible communications due to failure in your submission.
Please read below information carefully and respond all questions listed.
Question 1
The higher education department of Holmes Institute recorded data on the number of students enrolled in the different study majors for the years 2018 and 2019. The data are stored in file STUDYMAJOR.xls.
a.Use an appropriate graphical technique or chart to compare the number of enrolment in 2018 and 2019 of the different study major. Display the chart.
b.Use an appropriate graphical technique or chart to display the percentage value of the number of enrolment of the different study major in 2018 and 2019. Display the chart.
Note: Questions 2 to 6 are related.
Question 2
Sociologists argued that women on average earn less than men as women often choose to work less hours. They further suggest that the choice of hours worked may be driven by various factors such as age, childcare needs, occupation choice and flexibility. To investigate the relation between hours worked and income earned by Australian men and women, a researcher plans to survey a sample of individuals across the country. Briefly explain (using no more than 250 words in total for this question)
a.What type of survey method the researcher could use and why?
b.What sampling method could the researcher use to select his/her sample and why?
c.What are the two main variables the researcher should consider collecting data for the purpose of the above analysis and why? Identify the data type(s) for the variables.
d.What kind of issues the researcher may face in this data collection?
HI6007 Statistics For Business Decisions Assignment-Holmes Institute Australia.

Suppose a researcher has collected data from a sample of 65 individuals using the sampling method you have proposed in (b). For each individual, the hours worked per week and yearly income (measured in ‘000’s dollars) were recorded. The data are stored in file HOURSWORKED.xls.
Question 3
First, the researcher categorised the data into six location groups and six occupation groups, and calculated the frequencies given below.
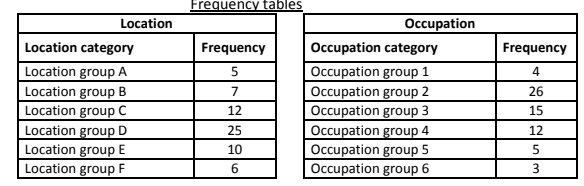
Using Excel and the data in the frequency tables above, answer the following questions.
a.Which graphical technique or chart should be used if the researcher is interested in comparing the number of individuals in each location group? Explain the reason for the selection of this graphical chart. Construct and display the chart, also briefly describe what you can observe about the number of individuals belonging to each location category.
b.Which graphical technique or chart should be used if the researcher is interested in comparing the proportion of the number of individuals in each occupation group? Explain the reason for the selection of this graphical chart. Construct and display the chart, also briefly describe what you can observe about the proportion of the number of individuals belonging to each occupation category.
Question 4
Second, the researcher wishes to use graphical descriptive methods to present summaries of the data on each of the two variables: hours worked per week and yearly income, as stored in file HOURSWORKED.xls.
a.The number of observations (n) is 65 individuals. The researcher suggests using 7 class intervals to construct a histogram for each variable. Explain how the researcher would have decided on the number of class intervals (K) as 7.
b.The researcher suggests using class intervals as 10 < X ≤ 15, 15 < X ≤ 20, …, 40 < X ≤ 45 for the hours per week variable and class intervals 40 < X ≤ 45, 45 < X ≤ 50, …, 70 < X ≤ 75 for the yearly income variable. Explain how the researcher would have decided the width of the above class intervals (or class width).
c.Draw and display a histogram for each of the two variables using appropriate BIN values from part (b) and comment on the shape of the two distributions.
Question 5
Third, the researcher wishes to use numerical descriptive measures to summarize the data on each of the two variables: hours worked per week and yearly income.
a.Prepare and display a numerical summary report for each of the two variables including summary measures such as mean, median, range, variance, standard deviation, smallest and largest values and the three quartiles.
Notes: Use QUARTILE.EXC command to generate the three quartiles.
b.Compute the correlation coefficient using the relevant Excel function to measure the direction and strength of the linear relationship between the two variables. Display and interpret the correlation value.
HI6007 Statistics For Business Decisions Assignment-Holmes Institute Australia.

Question 6
Finally, the researcher considers using regression analysis to establish a linear relationship between the two variables – hours worked per week and yearly income.
a.What is the dependent variable and independent variable for this analysis? Why?
b.Use an appropriate plot to investigate the relationship between the two variables. Display the plot. On the same plot, fit a linear trend line including the equation and the coefficient of determination R2
c.Estimate a simple linear regression model and present the estimated linear equation. Display the regression summary table and interpret the intercept and slope coefficient estimates of the linear model.
d.Display and interpret the value of the coefficient of determination, R-squared (R2).
ORDER Now This HI6007 Statistics For Business Decisions Assignment And Get Instant Discount