


ASSESSMENT TASK 2:
Description:
This assessment task has four tasks. Trainers/assessors may vary the data for the task for different students. Tasks may be scheduled according to classroom learning sessions and organised over a number of sessions to coincide with the relevant lessons and activities.
FNS60215 Advanced Diploma of Accounting Assignment-Australian Harbour International College.

1.Complete the following tasks using the given data set.
Assets $
Cash 200 000
Accounts receivable 400 000
Inventory 1 200 000
Plant 600 000
Total assets 2 400 000
Liabilities
$
Accounts payable 800 000
Long-term debt 400 000
Capital 1 200 000
2 400 000
Profit and loss
Sales 1 600 000
Cost of goods sold 1 000 000
Operating expenses 200 000
Interest 100 000
Taxes 100 000
Net profit 200 000
Find the following:
(a) Current ratio
(b) Quick asset ratios
(c) Inventory turnover
(d) Collection period
(e) Fixed asset turnover
(f) Times interest covered
(g) Net profit margin
(h) Return on total assets
(i) Return on capital.
The objective of the question is for ratio analysis. Refer following for the solution.
Explanation:
Answer (a) Current Ratio = Current Assets / Current Liabilities
Current Assets = Cash + Accounts Receivables + Inventory = $ 200,000 + $ 400,000
1.$ 1,200,000 = $ 1,800,000
Current Liabilities = Accounts Payables = $ 800,000
Therefore, Current Ratio = $ 1,800,000 / $ 800,000 = 2.25
Answer (b) Quick Assets Ratio = Quick Assets / Current Liabilities
Quick Assets = Cash + Accounts Receivables = $ 200,000 + $ 400,000 = $ 600,000 Therefore, Quick Assets Ratio = $ 600,000 / $ 800,000 = 0.75
Answer (c) Inventory Turnover Ratio = Cost of Goods Sold / Average Inventory
Cost of Goods sold = $ 1,000,000
Average Inventory = Closing Inventory = $ 1,200,000
Average Inventory is considered to be the closing inventory as there is no data on the opening inventory. Therefore, Inventory Turnover Ratio = $ 1,000,000 / $ 1,200,000 = 0.83
FNS60215 Advanced Diploma of Accounting Assignment-Australian Harbour International College.

Answer (d) Collection Period = 365 days / Accounts Receivable Turnover Ratio
Accounts Receivable Turnover Ratio = Net Credit Sales / Average Accounts
Receivables
Net Credit Sales = Total Revenue = $ 1,600,000
Average Accounts Receivables = Closing Accounts Receivables = $ 400,000
Average Accounts Receivables is considered to be the closing Accounts
Receivables as there is no data on the opening Accounts Receivables.
Therefore, Accounts Receivables Turnover Ratio = $ 1,600,000 / $ 400,000 = 4
Therefore, Collection Period = 365 / 4 = 91.25 days
Answer (e) Fixed Asset Turnover = Sales / Fixed Assets
Therefore, Fixed Assets Turnover = $ 1,600,000 / $ 600,000 = 2.67
Answer (f) Times interest covered = Earnings before interest / Interest
Earnings before Interest = Net Profit after taxes + Taxes + Interest = $ 200,000 + $
100,000 + $100,000 = $ 400,000
Times Interest covered = $ 400,000 / $ 100,000 = 4
Answer (g) Net Profit margin = Net Profit / Revenue = $ 200,000 / $ 1,600,000 = 0.125 or 12.5%
Answer (h) Return on Total Assets = Earnings before interest and taxes / Total Assets = $ 400,000 / $ 2,400,000 = 0.1667 or 16.67%
Answer (i) Return on capital = Earnings before interest and taxes / (Total Assets – Current Liabilities) = $ 400,000 / ($ 2,400,000 – $ 800,000)
Therefore, Return on Capital = $ 400,000 / $ 1,600,000 = 0.25 or 25%
2. The following data represents sales for 2005 to 2015:
Year Sales
2008 10 000
2009 11 000
2010 12 000
2011 12 500
2012 16 000
2013 18 000
2014 25 000
2015 40 000
2016 41 000
2017 43 000
2018 50 000
Based on the data,
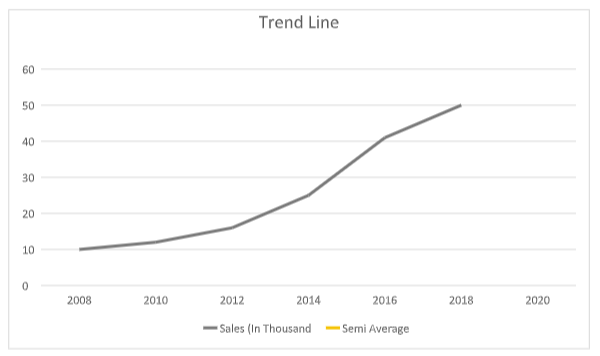
(a) Plot the data on a graph.

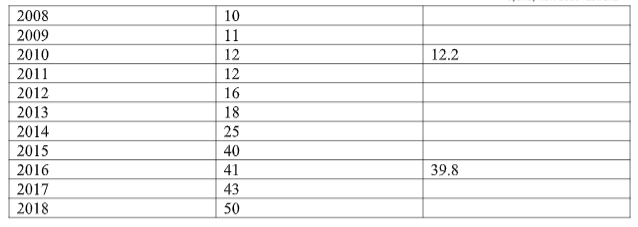
(b) Draw the secular trend line of best fit using semi-average method.
using method of semi average trend line of best fit is drawn (attach below)
In semi average method divide the whole data series in two equal parts
then find the average of two parts, from these two semi average we draw a trend line.
Here after leaving year 2013 the semi average of two parts is
1st part average =5(10+11+12+12+16) = 12.2
2nd part average = 5(25+40+41+43+50) = 39.8

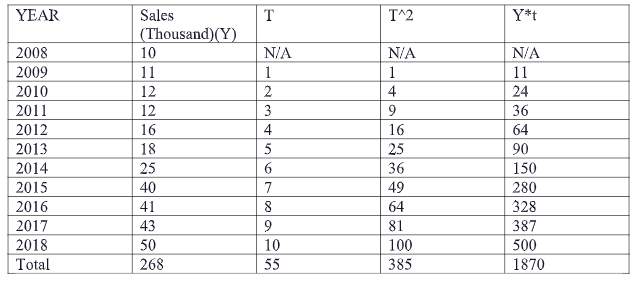
(c) With the data from 2009 to 2018 predict sales for 2019 with least square method of fore casting
For prediction we find estimated linear regression line as
yt=a+b∗t —–(1)
here, a and b is fitted value of parameters of model
For calculation purpose year are coded as t = 1,2,3…so on starting from 2009
So, using the least square method of estimation
the estimated coefficient a and b are—
b=∑t2−n(∑t)2∑y∗t−n(∑t∗∑y)
plug in all the values from the table attach below we get b = 4.8
a = n∑y−bn∑t = 0.4

thus the trend line is yt=0.4+4.8∗t
for predict sales for 2019 i.e for t = 11 trend line is yt=0.4+4.8∗11 = 53.2
Thus predict sales for 2019 = 53200
3.You are given the following data:
2 1 1 2 1 1 3 1 2 1 0
1 1 3 2 1 4 1 1 1 0 2
Required:
(a) Draw a histogram.
(b) Draw a frequency table.
(c) Draw a frequency polygon.
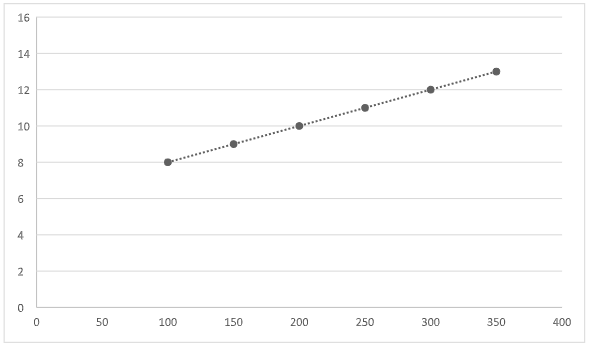
4. Calculate the correlation coefficient between advertising (x) and sales (y).
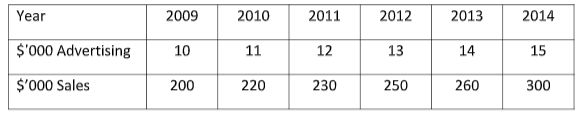
( b ) Describe the relationship between advertising and sales.
( c ) Find the equation of the regression line.
( d ) Plot the data for the annual sales versus advertising on a scattergram using the paper below. Start the x axis from 100 and the y axis from 8.
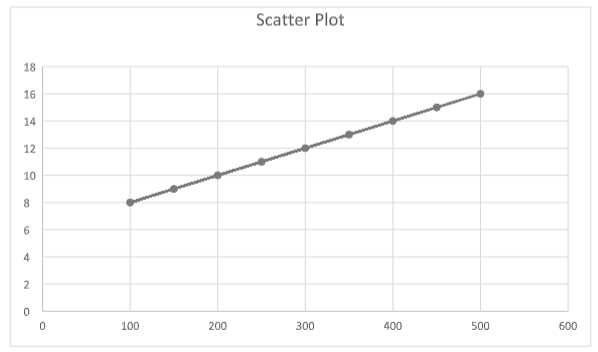
( e ) Use the regression equation to draw the line of regression on your scatter diagram.
( f ) If advert
If advertising is $16,000 in 2015 calculate the expected sales.
X = 16
Y = ?
y = 14.7619 + 18.2857x
y = 14.7619 + 18.2857*16
y = 307.3331
Sales = 307.3331
FNS60215 Advanced Diploma of Accounting Assignment-Australian Harbour International College.

5) Why is accurate data so important for business survival? What are some of the graphical data techniques that are used to illustrate statistics results?
If we want to predict the accurate trend of a business for its survival then we need the exact and accurate data or else the predicted trend can make wrong predictions and the business will be in loss. Graphical data techniques: Box plots, histograms, and normal probability plots, etc.
ORDER Now This FNS60215 Advanced Diploma of Accounting Assignment And Get Instant Discount