


ECON649/991 Economics Assignment
ASSIGNMENT (PARTS 1-4)
PART 1 (TOTAL MARKS PART 1 = 75)
EXERCISE 1: THE POOREST MAN’S COTTAGE (UNIT 1) (10 MARKS)
‘The poorest man may in his cottage bid defiance to all the forces of the Crown. It may be frail, its roof may shake; the wind may blow through it; the storms may enter, the rain may enter—but the King of England cannot enter; all his forces dare not cross the threshold of the ruined tenement.’ – William Pitt, 1st Earl of Chatham, speech in the British Parliament (1763).
- What does this quote tell us about the meaning of private property? (50 words maximum) (5 MARKS)
- Does it apply to people’s homes in the country where you were born? (50 words maximum) (5 MARKS)
ORDER This Assignment NOW And Get Instant Discount

EXERCISE 2: FIRM OR NOT? (UNIT 1) (5 MARKS)
Use the definition of the firm from the textbook. Discuss whether or not an eighteenth-century pirate ship can be classified as a firm. To answer this question, you should research the characteristics of pirate ships online and investigate if they satisfy the features that define a firm. (80 words maximum)(5 MARKS)
EXERCISE 3: THE MOVING ASSEMBLY LINE: CHANGES IN THE MANUFACTURE AND SALE OF CARS (UNITS 2 & 7) (60 MARKS)
- In 1913 Henry Ford began to manufacture the Model-T Ford using the moving assembly line. Technological improvements in the machine tools used to produce cars accompanied the innovations in the production process. The introduction of this new method of production was one of the great innovations in the manufacturing process. These new processes dramatically decreased the time it took to make each car. Before the introduction of the moving assembly line, it took 12 hours to produce one Model-T car. After the innovations, the time to make one Model-T decreased to around 30 minutes. All these changes meant that manufacturing process used more capital and less labour relative to the earlier more craft based production of cars.
You can watch the following 4-minute film clip of the significant innovations involved in the production of the Model-T Ford.
https://www.youtube.com/watch?v=cTZ3rJHHSik
Other car manufacturers in the United States quickly adopted the production techniques pioneered by Henry Ford.
One of the incentives that led to the introduction of the moving assembly line and other technological innovations in the production of cars in the United States was the increase in the wages of skilled workers required to produce cars using older production methods.
- Show on a diagram the two different technologies used to produce one Model-T car, i.e. the technology before (Technology A) and after the innovations by Henry Ford (Technology B). On the horizontal axis put the number of workers employed in the production process. (5 MARKS)
- Are either of the two technologies (A or B) dominant? Explain. (30 wordsmaximum) (5 MARKS)
- Use isocost lines to illustrate the costs of Technology A and B before the change in relative prices. Illustrate the impact on the isocost lines arising from the changes in relative prices caused by the increase in the wages of skilled workers. (5 MARKS)
- Discuss the impact on the incentives for firms arising from this change in relative prices. Incorporate the concept of economic rent into your discussion. (50 wordsmaximum) (5 MARKS)
- Henry Ford said that he wanted to make cars at a price that meant any middle-class American could afford to buy them. He achieved his goal with the price of Model-Ts declining from around $800 to less than $300 between 1908 and 1923. The lower price increased annual sales of the Model-T from around 10,000 to more’s than 2 million cars across the period.
Assume that the Ford company in this example has similar cost curves to the firm that manufactured Beautiful Cars (Unit 7 of the textbook).
- Illustrate diagrammatically the impact of the Ford company’s profit maximising choice of price and quantity arising from the innovations in the manufacturing process. (5 MARKS)
- Explain any assumptions you may have made in drawing this diagram/s. (40 wordsmaximum) (5 MARKS)
- Continue to assume the firm faces a similar cost curves to the firm that manufactured Beautiful Cars (Unit 7 of the textbook). At the end of World War 2, car companies were able to sell to the highest bidder because the demand for cars was greater than U.S car manufacturers could supply. In the United States in 1958, the problems for consumers caused by this bidding war led to the introduction of a law that mandated that car yards place a price on the car.
- Discuss the impact of the bidding war between consumers, on prices that car yards were able to charge customers. Outline the impact on the size and distribution of the gains of trade between the customers and the firm. Illustrate on the appropriate diagram. (40 wordsmaximum) (5 MARKS)
- Discuss the impact of the law that forced car yards to place a price on the car. This discussion should include the impact on prices and the size and distribution of the gains of trade between the customers and the firm. Illustrate on the diagram. (40 wordsmaximum) (5 MARKS)
- Discuss the impact of the internet on the size and distribution of the gains from trade between the sellers of cars and its customers. Illustrate on the appropriate diagram. (40 wordsmaximum) (5 MARKS)
- Which of the situations in the car market outlined in a) b) and c) are Pareto efficient? Explain. (50 wordsmaximum) (5 MARKS)
- In the previous question, we assumed that car firms had a particular set of cost curves. However, the cost curves for car manufacturers using mass production techniques could be different.
- Draw a set of alternative cost curves (total cost, average cost and marginal cost) for car manufacturers that use mass production techniques. (5 MARKS)
- Explain the reasons behind your representation of the cost curves. (40 wordsmaximum) (5 MARKS)
ORDER This Assignment NOW And Get Instant Discount
PART 2 (TOTAL MARKS PART 2 = 35)
EXERCISE 1 (UNIT 3) CETERIS PARIBUS ASSUMPTION(5 MARKS)
Read Section 3.1 “Labour and Production” in the textbook. You have been asked to conduct a research study at your university, just like the one at Florida State University. In addition to study environment, outline two factors that you think should ideally be held constant in a model of the relationship between study (leisure) hours and final grade? (30 words maximum)(5 MARKS)
EXERCISE 2 (UNIT 3) YOUR PRODUCTION FUNCTION(15 MARKS)
Read Sections 3.1-3.6 in the textbook. Use the model that examines Alexei’s choice between his final grade & free time.
- What could bring about a technological is improvement in your production function (the relationship between study hours and your marks) and those of your fellow students? Outline two of these potential changes that could improve the relationship between hours spent studying and the marks gained. (40 words maximum)(5 MARKS)
- Analyse what might happen to your optimal choice of free time and final grade, and the choices that your peers might make. (50 words maximum). (5 MARKS)
- Illustrate on a diagram (feasibility frontier and indifference curves) the impact on YOUR choice arising from the technological improvement associated with your studies. (5 MARKS)
EXERCISE 3 (UNIT 3) LONG TERM LEISURE (15 MARKS)
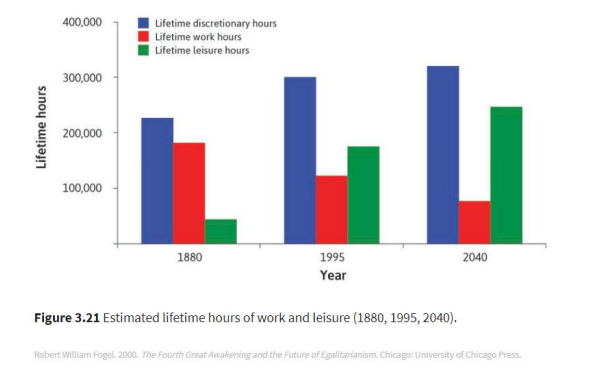
“The high-income economies will continue to experience a major transformation: the declining role of work in the course of our lifetimes. We go to work at a later age, stop working at an earlier age of our longer lives, and spend fewer hours at work during our working years. Robert Fogel, an economic historian, estimated the total working time, including travel to and from work and housework, in the past. He made projections for the year 2040, defining what he called discretionary time as 24 hours a day minus the amount we all need for biological maintenance (sleeping, eating and personal/home hygiene). Fogel calculated leisure time as discretionary time minus working time.” (Unit 3, Section 3.9)
Use the constrained optimization model outlined in Unit 3 (Sections 3.1-3.6) to analyse the increase in lifetime leisure in high-income countries, which is shown in the diagram below.
Source: Unit 3, Section 3.9
- Outline the reasons for the increase in (lifetime) discretionary hours in high income countries between 1880-1995. (40 wordsmaximum)(5 MARKS)
- Illustrate the impact of technological innovation on discretionary hours, and the choice between leisure and annual earnings in 1880, 1995 and the predicted changes for 2040. (5 MARKS)
- Outline the reasons for the outcomes in 1880, 1995 and 2040 that you have illustrated on your diagram. (50 words maximum) (5 MARKS)
ORDER This Assignment NOW And Get Instant Discount
PART 3(TOTAL MARKS PART 4 = 40)
EXERCISE 1 INCOMPLETE CONTRACTS (SECTION 6.1-6.3 & 6.10)(10 MARKS)
- What would you include in a university lecturer’s employment contract, if you want to influence the effort put into teaching? (40 words maximum)(5 MARKS)
- What can’t or would be difficult to include in the contract? (40 words maximum)(5 MARKS)
EXERCISE 2 ECONOMIC RENTS (SECTIONS 6.4-6.5)(10 MARKS)
Rip Curl is an Australian company that began operations in 1969. It was originally involved in the manufacture of surfboards but it expanded the scope of its business so that is now one of the biggest companies involved in the design, manufacture, and sale of surf and snow wear.
Ripcurl in the 1970s manufactured all its products in Australia. In 2017 there is only one Ripcurl factory left in Australia. Joe is employed in this factory, which makes clothing for Ripcurl. He earns $25/hour and works 40 hours each week. The job is repetitive and boring. He values the hourly disutility of work at $5. If he were to lose his job he would qualify for unemployment benefits and receive $535.60 every 2 weeks. There is no time limit on the receipt of unemployment benefits in Australia. Joe is 47 years old and the average length of unemployment in Australia for those aged 45 to 54 years is 63 weeks.
- Calculate the economic rent for Joe.(5 MARKS)
In 2016, Ripcurl was heavily criticised for outsourcing some of its clothing production to a factory in North Korea, located near the border with China. The criticism centred on the pay and work conditions of people in the factory. This included being forced to work 7 days per week (without additional compensation), averaging more than 70 hours per week. In fact, workers are paid very little in cash. Most of their wages in this factory are received as food coupons that can only be used at government run stores to purchase rice and corn. Workers who do not obey orders can be imprisoned in labour camps where there is no pay and the conditions are much worse.
- Discuss the size of the economic rent received by the North Korean workers in the Ripcurl factory. Your answer must include a reference to the relationship between the hourly wage, the disutility of effort and their reservation wage. (100 words maximum)(5 MARKS)
EXERCISE 3 LABOUR-DISCIPLINE MODEL (SECTIONS 6.6-6.8)(20 MARKS)
Ripcurl claims it did not know about the factory in North Korean, stating that one of its Chinese suppliers had outsourced the work to the factory without their permission. Workers in factories in North Korea can produce 30% more clothes each day than Chinese workers.
We know little about the wages of factory workers in North Korea except for those at the Kaesong industrial zone just across the border from South Korea. The wages in these factories are higher than elsewhere in North Korea as they were negotiated as part of a deal between the North and South Korean governments. The wages for North Korean workers in the industrial zone ranges from a minimum of around $75 a month to an average of around $160. This compares with an average factory wages of $450-$750 a month in China.
- On the same diagram draw the best response curve for the workers in North Korea industrial zone and China (with the daily wage on the horizontal axis, and daily effort on the vertical axis). (Hint: Think about the possible differences in the slope of the best response function).(5 MARKS)
- Explain your diagram. (80 words maximum)(5 MARKS)
- On a new diagram illustrate the cost minimizing/profit maximizing choice for owners of factory’s in North Korea and China.(5 MARKS)
- Based on the above analysis is there involuntary unemployment in North Korea and China? (50 words maximum)(5 MARKS)
PART 4(TOTAL MARKS PART 4 = 60)
EXERCISE 1: PRICE ELASTICITY OF DEMAND FOR TOBACCO & TAXATION(45 MARKS)
Most studies find that younger people are more sensitive than older people to increases in the price of cigarettes. The average price elasticity of cigarettes for teenagers is –1.43, –0.76 for young adults, and –0.32 for adults. Another factor influencing elasticity is income with studies in high-income countries finding greater price sensitivity of tobacco among those on lower incomes.
- Each year on 1 September the tax on tobacco products increases. The tax amounts to a 12.5% increase in the price of individual cigarettes. Discuss the impact on government revenue. (50 words maximum)(5 MARKS)
- Provide two reasons for the differences in price elasticity of demand for the different age groups. (25 words maximum)(5 MARKS)
- Explain the greater price sensitivity of demand for tobacco amongst lower income groups. (30 words maximum)(5 MARKS)
- Assume the demand for cigarettes amongst low income groups is price inelastic (even if it is more elastic than higher income groups). Discuss the impact on the budgets of these consumers arising from the annual increases in taxes on tobacco. (30 words maximum)(5 MARKS)
- Use the supply and demand diagram. Illustrate the impact of levying a tax on cigarettes on the welfare of consumers and suppliers. (5 MARKS)
- Discuss the impact on welfare from the levying of taxes on cigarettes shown in the previous diagram. Refer to the impact on the consumer& producer surplus. (50 words maximum)(5 MARKS)
Half of the people who smoke cigarettes will die early from a smoking-related disease. In Australia, that works out to about 15,000 deaths per year. In Australia smokers spent over 750,000 days in hospital each year — leading to hospital costs of about $670 million.
- Is a broader definition of welfare (one that includes more than the consumer & producer’s surplus) more useful in analysing the welfare impact of taxing cigarettes? (50 words maximum)(5 MARKS)
In Australia, the proportion of smokers using roll-your-own tobacco has increased in recent years. Now around 24% of smokers in Australia smoke rollies rather than factory (tailor) made cigarettes. This is because the effective tax levied on tailor made cigarettes has been higher than the tax on each roll-your-own cigarette.
Unfortunately,rollies are more harmful thantailor-made cigarettes.Rollies have about 38 times more additives than factory-made cigarettes. These additives include chemicals that are associated with cancer and other smoking related diseases. Another factor in the health risk of rollies is that they are usually thinner, causing people to suck harder, which increases the amount of tar you inhale. Studies have shown that the increased risk of cancer from smoking rollies is two to three times higher than the risks from smoking tailor-made cigarettes.[1]
- Use the supply and demand diagram. Illustrate the impact of the differential taxation on the market for rollies. (5 MARKS)
- Discuss again the impact on welfare from the taxation of tobacco products. (Hint: Address the impact from the switch to rollies). (30 words maximum)(5 MARKS)
EXERCISE 2: PRICE-TAKERS AND PRICE-SETTERS(15 MARKS)
- Governments in high-income countries introduced advertising bans on tobacco products in the 1990s. Discuss the potential impacts on the slope of the demand curve from the ban. (40 words maximum)(5 MARKS)
- Discuss the potential impact of the ban on tobacco advertising on the price setting power of tobacco companies.(50 words maximum)(5 MARKS)
- Illustrate diagrammatically the potential impact on the profit maximising choice of tobacco companies arising from the ban on advertising. (Ignore the impact on the costs of the company from the ban on advertising). (5 MARKS)
ORDER This Assignment NOW And Get Instant Discount
[1] Note that the tax on loose-leaf tobacco increased on the 1 September 2017 so that the tax on each rollie is equivalent to the tax on each tailor-made cigarette.